Technical Analysis Learning Modules

Click on any of the topics below to expand and start learning

Candles have two essential parts: body and wick (wick can be both up and down). The body of the candle looks like a pillar candle. The wick can extend in either direction of the body, up or down. To visually break it down, both candlesticks look like this:
 
 
The following price points are required to create each candle:
 
Opening: It is the first trading price of the asset recorded within the specified period. If the price starts to rise, the candle turns green, and if the price goes down, it turns red.
 
Highest: The highest recorded trading price of the asset within the specified period. The top of the wick shows the highest price traded during the period. If there is no wick, it means that the closing price is the highest traded price.
 
Lowest: The lowest trading price of the asset recorded within the specified period. The lowest traded price is the price below the wick. If there is no lower wick, the lowest price traded is the same as the open price on a bullish candle.
 
Closing: The last purchase and sale price of the asset is recorded within the specified period. The closing price is the final price traded during the candle formation phase. If the closing price is below the opening price, the candle turns red. If the closing price is above the opening price, the candle will turn green.
 
Colors in a candle chart that help us understand the price direction. Basically, if the candle price closes above the candle’s opening price, the price will move up, and the candle will turn green. If the candle is red, the closing price is below the opening price.
 
Most frequently seen candlestick patterns:
Bullish reversal patterns
● Hammer
● Inverted hammer
● Three white soldiers
● Bullish harami
 
Bearish reversal patterns
● Hanging man
● Shooting star
● Three black crows
● Bearish harami
 
Continuation patterns
● Rising three methods
● Falling three methods
● Doji
What are S/R Lines?
 
Support Line: A support line is a line that indicates where the buying pressure is higher than the selling pressure in an area. Price is likely to bounce upwards from this area.
 
At the support line, demand is usually greater than supply so an upward move in price is probable.
 
Resistance Line: It is the exact opposite of a support line; A resistance line is a line that indicates where the selling pressure is higher than the buying pressure in an area. It is likely for price to reject from this area.
 
At the resistance line, supply is usually greater than demand so a retracement/rejection in price is probable.
 
What is a S/R Flip?
 
A S/R flip is when previous support turns into new resistance or when previous resistance turns into new support. This happens when price breaks through support levels and then price starts moving upwards then that previous support level is now considered as a resistance level, vice versa for resistance lines.
 
The chart below is an example of price action when we take Support and Resistance lines into consideration:
Types of Trends
 
There are only 3 types of trends
 
Uptrend: Consistent higher highs and higher lows make up an uptrend.
 
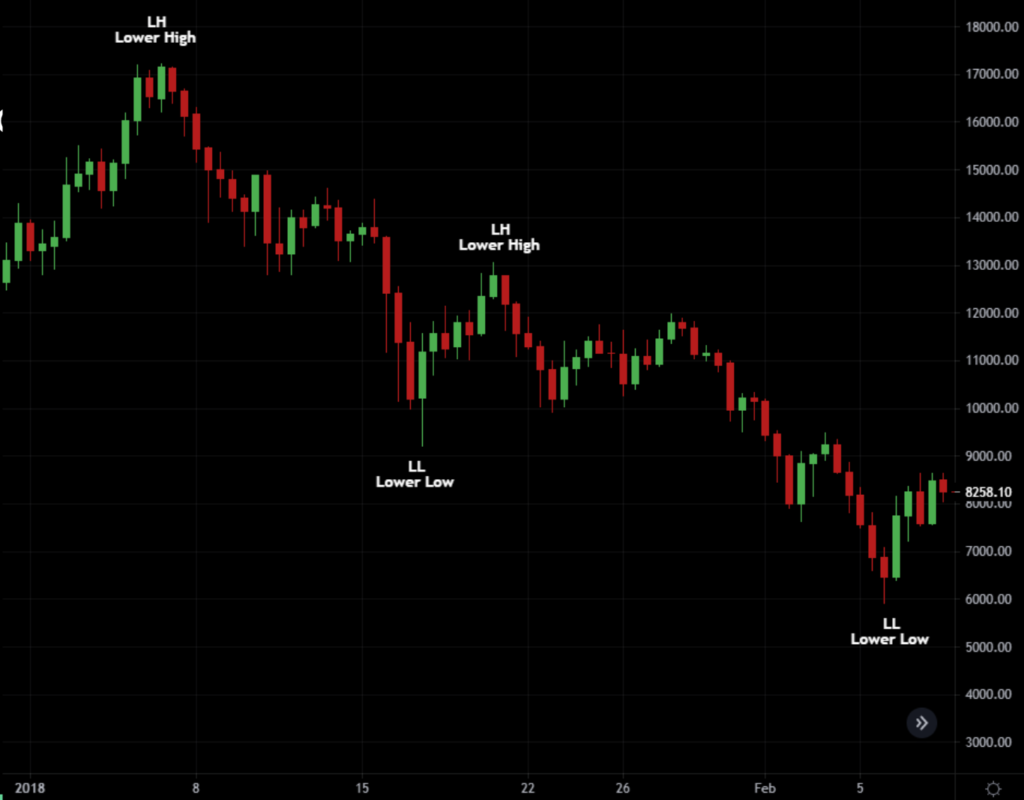
Downtrend: Consistent lower highs and lower lows create a downtrend.
 
No visible trend: Market moving sideways, confined in a range (usually between support & resistance)
 
Uptrend:
In an uptrend, price usually breaks through resistance & holds support levels

 
Downtrend:
In a downtrend, price usually breaks through support & rejects off resistance levels

 
No Trend / Ranging Market / Sideways Market / Crabbing Market: (Many names for it but its the same)
 
In a ranging market, price usually bounces off both support & resistance levels


How and Why we draw Trendlines:
 
How:
 
● Connect major swing points rather than minor ones
● Adjust trendline to align with chart data
 
Why:
 
● Tells us where we can expect price to bounce/reject
● Finding the right entries and exits
 
Example of Downtrend and Uptrend lines:
Example of a trendline within a trendline:
What is a Moving Average?
 
The moving average is one of the simplest forms of TA. This line indicator is the average calculation of previous price points in a given window. Moving Averages are generally used to identify trend direction and/or support and resistance levels. It is a lagging indicator since it is based on past prices.
 
The longer the time period for the MA used, the greater the lag behind it; So in this case, a 200-day MA will have a greater level of lag/delay compared to a 20-day MA because the 200-day MA contains price data for the past 200 days whilst the 20-day MA only takes into account the past 20 days. The 50-day MA and the 200-day MA are the most common MA’s that are looked at.
 
Shorter moving averages are typically used for short-term trading, while longer-term moving averages are more suited for long-term trades and macro trend identification.
 
MA’s on a chart:
 
SMA vs EMA
 
Simple Moving Averages and Exponential Moving Averages are very similar but they are calculated differently. The EMA is quicker to react to price changes because it emphasizes on recent price action whilst the SMA reacts slower and smoother to the most recent price action. There is no better MA. This is all up to preference of the trader.
 
What is the Relative Strength Index (RSI)?
 
The Relative Strength Index indicator is a momentum oscillator that indicates if price is oversold or overbought.
 
Usually, if the RSI reading is above 70 it is considered as overbought and if the RSI reading is under 30 it is considered as oversold.
 
Note: Overbought doesn’t necessarily mean the price will reverse lower, just like oversold doesn’t mean the price will reverse higher. Rather the overbought and oversold conditions simply let traders know that the RSI is near the extremes of its recent readings.
The RSI can tell us if the price movement is backed up by the buying/selling pressure. We usually look at the RSI for divergences, which is discussed in-depth in its own channel.

What is the Stochastic RSI?

A derivative of the Relative Strength Index. It consists of two lines, K (usually blue) and D (usually red).

When blue line crosses over red line it is considered as a bullish crossover

When red line crosses over blue line it is considered as a bearish crossover

What do we use the Stochastic RSI for?
 
It is usually used to identify if the end of the move is close or not, usually when we have a Bearish Crossover, price also seems to start going down and when we have a Bullish Crossover, price also seems so start moving up. Keep in mind no indicator should be used alone and should be used in confluence with other indicators.
 
Please note that you should never use crossovers alone as an indicator to enter a position, you should never use a single indicator to identify trade entries.
What are Divergences?
 
When price moves in a certain direction, the RSI should ALSO move in the same direction. (If prices makes higher high, so should the RSI)
 
If the RSI does NOT follow the same direction as the price, we consider this as a divergence.
 
There are both bullish and bearish divergences;
 
To find bullish divergences, always look at the LOWS of the RSI
To find bearish divergences, always look at the HIGHS of the RSI
Bullish Divergences:
There are 3 Bullish Divergences:
 
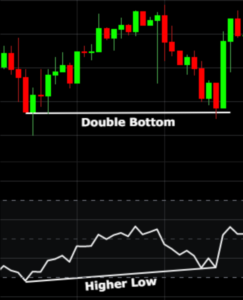
1. Strong Bullish Divergence: is when price makes lower low but the RSI makes a higher low


3. Weak Bullish Divergence: is when the price makes a lower low but the RSI makes a double bottom

 
Bearish Divergences:
There are 3 Bearish Divergences:
 
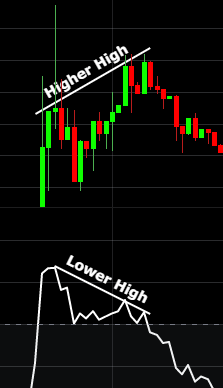
1. Strong Bearish Divergence: is when price makes a higher high but the RSI makes a lower high
 
2. Medium Bearish Divergence: is when price makes a double top but the RSI makes a lower high
 
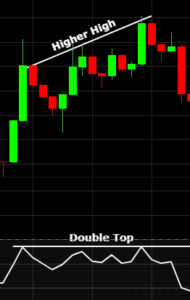
3. Weak Bearish Divergence: is when price makes a higher high but the RSI makes a double top

 
Please note that you should never use divergences alone as an indicator to enter a position, you should never use a single indicator to identify trade entries.
What is the Fibonnaci Retracement Tool?
 
Fibonnaci Retracement Levels are lines that indicate where possible support and resistances could occur based on fibonacci numbers. Each level is associated with a level and they show how much of a retracement price has had.
 
The main Fibonnaci Retracement Levels that are used are 23.6% [0.236], 38.2% [0.382], 61.8% [0.618], 78.6% [0.786]. The level 50% [0.5] is also used since it is a strong psychological level but it isnt necessarily considered as a Fibonacci level.
 
This indicator is usually drawn between two points; A high and a low, usually major swing levels & this indicator will show you possible levels of retracement (Where price could potentially pullback towards before continuing the move)
 
The “Golden Ratio” majority of traders praise is the 0.618 [61.8%] or 1.618 [161.8%] level, since most of the times price does start to reverse after hitting these levels.
 
The images below will show you how to set up the Fibonacci Retracement Tool in both long and short scenarios:


For Short Opportunities:

You can clearly see in both images that price does end up bouncing or rejecting around the fibonacci levels, ofcourse this doesnt have a 100% hit rate, nothing does. Always use Fibonnaci Retracement Tool with other indicators and find as much as confluence as you can.
What is a stop loss?
 
A stop loss is pretty self explanatory, it stops you out of your position at a certain price to avoid losing more than what you would have lost. Basically, saves you from liquidation and unnecessary losses. If you do not use a stop loss when you trade, your chances of bankruptcy is insanely high, especially for leveraged trades.
 
You should NEVER have a fixed stop loss, meaning, you shouldn’t set a 3% stop loss for every trade you enter, you will unnecessarily get stopped out and just end up continuously losing money.
 
Your stop loss should be right under your invalidation price.
 
What is an invalidation price?
 
You enter the trade for a reason, lets say, in this case, you entered a trade because price hit support and bounced off the support level, your invalidation price should be just slightly under the support level to avoid large wicks that are meant to hunt stop losses.
 
Your invalidation price tells you that the trade you originally entered has been invalidated, in this case, the support that price bounced off on was broken and turned into resistance.
 
 
                                                                        You must always have an invalidation price for every trade that you enter!
 
 
What is stop loss hunting?
 
Big position traders, whales, institutional traders or market makers, whatever you’d like to call them, purposefully stop out retail traders, people like you and I, they do this by moving price to a certain area where majority of people have their stop losses set at, this is why you usually see massive wicks right before an explosive move. It’s really smart to have a safe stop loss, not one where you’d lose a big percentage of your account and not one where you’d get stopped out with the slightest wick.
 

What is the Volume Weighted Average Price (VWAP)?

VWAP is similar to a moving average, but the difference between the both is that it incorporates not only price but also volume. Where the VWAP is, there is a lot of volume transacted in that area. When price is below VWAP then it is considered as below value price but when it is above VWAP then it is considered as above value.

How can we use the VWAP indicator?

VWAP is usually used as a S/R line. The daily VWAP and weekly VWAP are usually STRONG S/R zones. We are usually looking for a VWAP Cross, which basically means when price crosses over the VWAP and finds support, it is usually a good sign that price will start moving up, vice versa for selling; if price hits resistance on the VWAP and rejects, it is usually a good sign that price will start going down. 

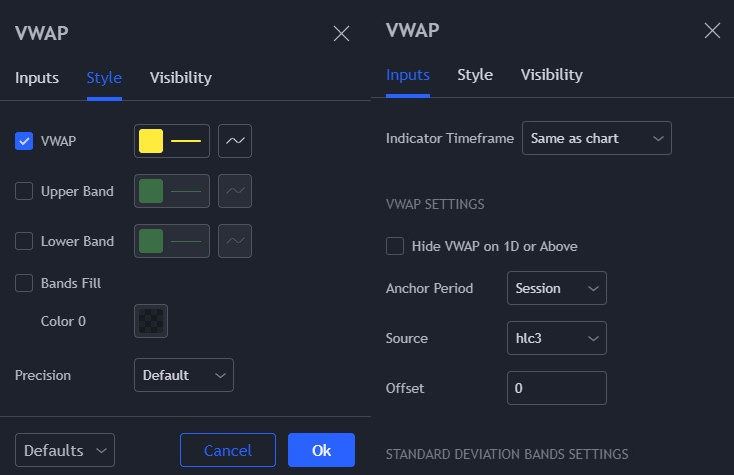
To use the VWAP in short-term trading, make sure you have the settings on session VWAP as seen below;

Color settings are totally optional, yellow just suits well for me. You need to change the Anchor Period to session for short-term trades
Using this indicator in confluence with the Stochastic RSI, Volume & Candlestick patterns, you will find success in short trades here and there;
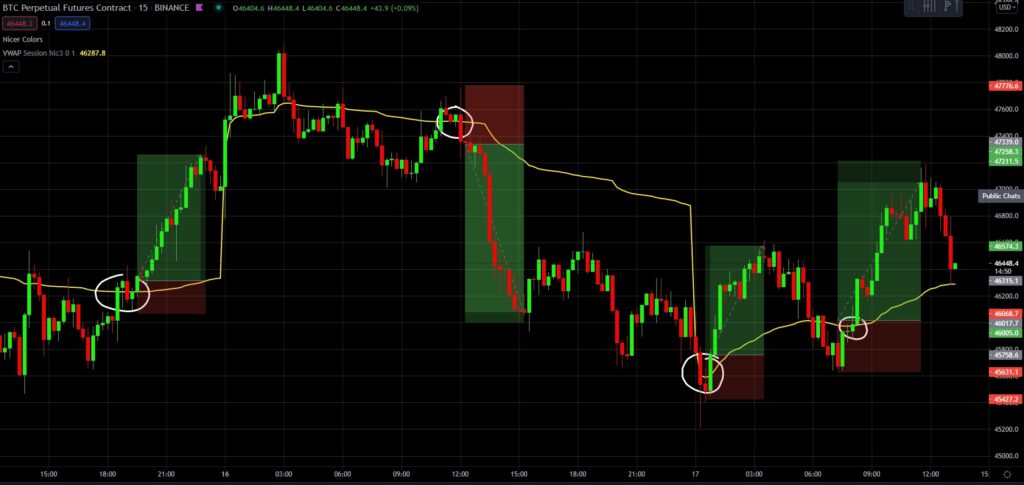
Please note that you should never use VWAP alone as an indicator to enter a position, you should never use a single indicator to identify trade entries.